QC Story – The Remedial Process and Process Control
QC Story – The Remedial Process and Process Control
by: Quest Claire
Find this article helpful? Share it with others.
In the previous article, we confirmed the theory that the spray-painting mask with a narrow opening must be cleaned with a chemical solvent every 10-30 sprays to prevent any excess paint from staying next to the opening, causing blockage to the spraying operation.
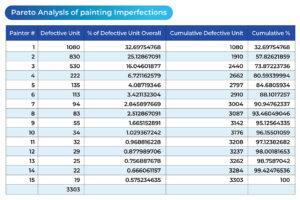
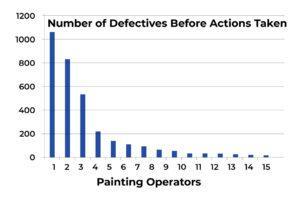
I want to review the process improvement by examining the number of defects these 15 painting operators produced again. The following table and chart (see Table 1 and Chart 1) represent the overall production situation before the corrective action was taken, showing the number of defects produced during the 4-week production period.
Table 1
Chart 1
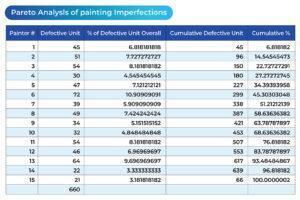
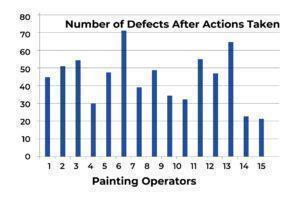
The following table and chart (see Table 2 and Chart 2) represent the overall production situation after the corrective actions were taken, showing the corresponding number of defects produced during the 4-week production period.
Table 2
Chart 2
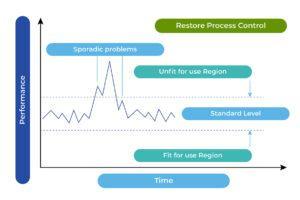
Based on the above four charts, each of which presents the overall production situation during a period of 4 weeks using the inspection records on the work of the same 15 painting operators, the factory production manager was able to conclude that the major assignable cause for the defects was identified. The sporadic problems (the vital few) had been resolved (see Chart 3). The process was restored to a “controlled” state, as outlined in the following chart. The 4-week total number of defects from the 15 operators was reduced from 3303 to 660.
Chart 3
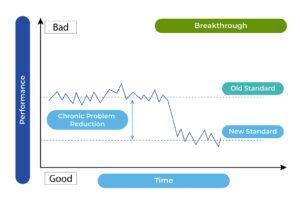
To further improve the process capability, the other “trivial many” problems must be identified, many of which may fall into chronic problems. Corrective actions for such problems vary and must be dealt with separately. The success of taking any necessary company-wide measures may be considered to reach a further improved standard as outlined in the following chart (see Chart 4).
Chart 4
Usually, company-wide actions are expected to take substantial efforts, and as a result, quality costs will be a determining factor to justify the implementation of such actions. Such costs could be coming from new production equipment, shifting component suppliers, … etc. a possible major change of company culture in production. When a new, superior level of performance is attained due to taking the necessary breakthrough actions, the factory’s production capability will be further enhanced.
Process Capability and Control
Before discussing this subject, I like to revisit the original goal and extend the discussion into process improvement by clarifying the following concepts indispensably related to process control.
Process control is defined as an activity that ensures a process is steady, predictable, and constantly operating at the set level ofperformancewith the help of normal variation. In simple terms, it is described as a method for improving and controlling a process with the help of statistical analysis.
Process controlis an important tool implemented in different industries like power generation plants, chemical processing, food and beverage industry, manufacturing, and oil refining, in addition to our subject matter of consumer product production. This production process is used to achieve a safe, economic, and consistent production level that is impossible just with manual control by humans. It helps manage and monitor complex processes to high consistency levels. It includes the ways through which machines and industries accomplish a task.
Process capability study is important as any process improvement activities must be carefully investigated before implementation. One of the most widely encountered situations when a process change is “the process can’t hold the tolerances”. Also, capability studies are widely adopted to cover process variables when the variables are considered to be normally distributed. Testing this theory requires a study of current production to determine the “process capability”. Once this capability has been measured, it can be compared with the tolerances to determine whether the process can hold the tolerances.
Process Capability Analysis
Process capability measurement is the quantifying and predictive aspect of using the process capability concept. This measurement is conducted without any need to know the product’s tolerance. The 6s value that expresses inherent capability does not refer to tolerance.
In contrast, the use of the measurement capability is largely for two main purposes, both of which do involve the tolerances:
1. As an aid to prediction — to answer the question: Will this process hold the specified product tolerance?
2. As an aid to analysis: “Why does this process not hold the specified product tolerance?”
“Process capability analysis” refers to studying the process to answer both these questions.
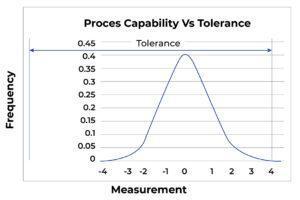
Inherent Reproducibility versus Tolerance
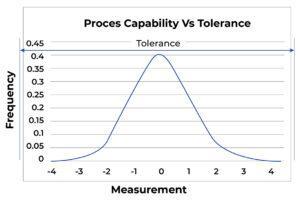
The most elementary form of process capability analysis compares inherent process reproducibility with product tolerance. Figure A shows such a relationship graphically, showing that the process can meet the tolerances.
Figure A
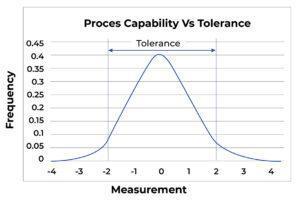
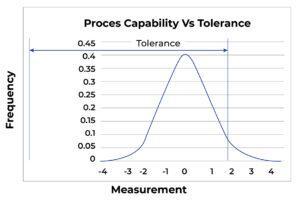
In contrast, Figure B shows the same process as Figure A but operates so narrowly against a tolerance that defects are inevitable. Here it is evident that the process cannot meet the tolerance.
FigureB
Why do Adequate Processes fail to Hold Tolerances?
In practice, there are many situations in which tolerances still need to be met, even though the inherent reproducibility of the process is adequate to meet the tolerances. A few major reasons account for most of these failures.
Process Misdirected: Figure C shows the same process as Figure A shows. However, the “centering” of the process in Figure C is marginal, and the process is in danger of producing defects. In Figure D, the identical process is now so poorly centered that defects are being produced.
FigureC
FigureD
There is yet another useful tool in process control which I will discuss in the forthcoming article: Control Charts. In particular, the control chart for the Percentage of Defective (p Control Chart) will be introduced. This tool is valuable for many of our vendors engaged in consumer product production.
We use cookies to ensure that we give you the best experience on our website. If you continue to use this site we will assume that you are happy with it.