
QC Story – The Pareto Principle
by: Quest Claire
Find this article helpful? Share it with others.

I like to continue presenting the QC Story Procedure to the concerned parties for some of our vendors to include this important concept of the Pareto Principle.
In the previous article, I had an in-depth discussion on defining The Problem within the framework of The QC Story Procedure, by outlining the difference between sporadic and chronic problems and defining some critical terms often used in process improvement. Now, to continue the discussion of The QC Story Procedure, I would like to present a case study in which I worked with the management team of a toy factory and expect to share these concepts with our other vendors interested in improving their QC capability.
From talking to many of our vendors, their management knows that the numerous situations and problems they face are equally important. For example, roughly 20% of the customers (the “key” customers) account for over 80% of the sales in marketing. In purchasing, a few percent of the purchase orders account for the bulk of dollars of purchase. In inventory control, a few percent of the catalogue items account for most of the dollar inventory. In cost analysis, roughly 20% of the parts contain 80% of the factory costs, and the basic function of a product roughly accounts for 80% of the product cost. In comparison, the secondary and other functions account for 20% of the cost.

In quality control, the bulk of the field failures, downtime, shop scrap, rework, sorting, and other quality costs appear to be traceable to a vital few field failure modes, shop defects, products, components, processes, vendors, designs, operators, etc.
Looking at the bigger picture, we also see some parallels in our world, presenting a similar phenomenon. For example, a few percent of the people own most of the wealth; a few countries account for most of the world’s population. The principle extends to biological and other natural phenomena, e.g., a few percent of the biological species account for the bulk of the animal population; one planet contains the bulk of the solar system’s mass. The principle of the “vital few and the trivial many” runs through all these phenomena. The vital few members of the assortment account for most of the total effect. The bulk of the members (the trivial many) account for very little of the total effect.
Based on such observation, many people become aware that this phenomenon of vital few and trivial many is a universal concept which warrants the attention of all of us. Such a phenomenon is called the “Pareto principle”.
Such a great concept calls for a major use of the Pareto principle in designing quality improvement programs. Here the principle has so wide an application that no intelligent approach to quality improvement is possible without it. Improvement can be justified only for the vital few projects. It is these projects which contain the bulk of the opportunity for improvement in failure rates, quality costs, downtime, process yields, etc.
The vital few projects are identified through a “Pareto analysis.” In its most basic form, this consists of listing the contributions to the problem in the order of importance. For example, in this case study, I worked with the production manager and QC manager of a toy factory. I obtained their willingness to share this study with other factories for education. In reviewing their production information and inspection data record, I got the following Problem Chart which is a listing of the work of 15 operators in their toy spray painting operation. The operators are shown in the order reflecting the extent to which they produced painting defects during a production period of 4 weeks.
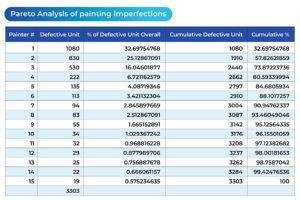
From the above table, it is seen that there are striking differences in the extent of painting defectives among these operators. For example, painter #1 accounted for 1080 defective units, or 32.7% of all the defects, whereas several other painters (from #11 to #15), each of them accounted for less than 1% of all the defectives.
When the data are accumulated (right-hand columns of the above table), it is immediately evident that the first three painters (the vital few, #1, #2, #3) accounts for 73.8% of all the defectives. In contrast, the lowest 10 painters (the trivial many, from #6 to #15) accounts for only 11.9% of all the defectives.
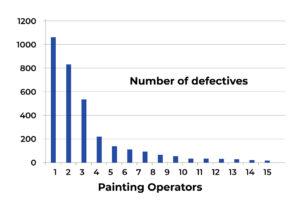
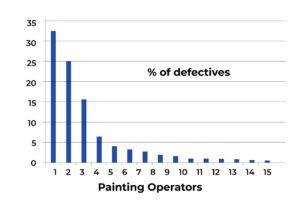
A graphical presentation of the data in the above table is shown in the following charts.
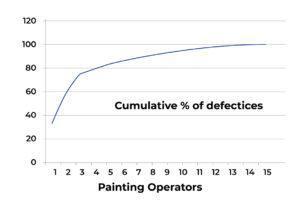
The following chart shows the relationship between the individual painter’s contribution to the percentage of the cumulative total of the spray-painting defectives.
The Diagnostic and Remedial Process
The activities known as defect prevention, quality improvement, quality cost reduction, troubleshooting, etc., all originate in an awareness of the undue presence of defects and a determination to do something about them. Once this determination has been made, the possibility of removing these defects depends largely on the successful completion of two processes: diagnostic and remedial.

The diagnostic process consists of the following:
1. Study of the symptoms surrounding the defects to serve as a basis for theorizing about the causes
2. Theorizing on the causes of these symptoms
3. Experiment and/or Analysis to establish the true causes
The remedial process usually begins when the true causes are known. It consists of the following:
1. Proposals of alternatives for the remedy
2. Selection and application of the remedy
3. Provisions to hold the gains
Successful completion of these two processes is aided considerably by a clear understanding of what is meant by each of the key steps involved.
Sometimes, the diagnostic could be the main source of confusion for these two processes. The reason for this is, in part, organizational. For sporadic defects, i.e., in troubleshooting, the responsibility for diagnosis is usually clear, and therefore it falls within the present scope of this Pareto discussion. For chronic defects, this responsibility is sometimes not clear, as that may fall within multiple departments as a company-wide responsibility. When that happens, it leads to a result that no one may follow the diagnostic process. Since that is a more complicated subject for discussion, it falls beyond the scope of this article.

However, sometimes the main source of confusion could be in concepts and terminology. In reviewing the in-process manufacturing data from some of our other vendors, I observed the following common confusions as related to the production of our products.
1. Confuse symptom with a cause: For example, internal scrap data sheets often have a column headed “cause,” under which are listed such terms as “undersize,” “broken,” etc. The word “cause” is used in the sense of “reason for scrapping.” However, such usage leads managers to assume that the cause of the defects is really known and that hence no real diagnosis is needed.
2. Confuse theory with a cause: In discussing causes of defects with the production engineers, it is common that among numerous theories to be investigated and analyzed, sometimes I heard about the claiming of the cause of a defect without any explanation, but simply a confirmation of an experience from a previous production. That means that production engineers may be personally convinced regarding the cause of the defect based on their own feelings. However, they lack the data which can convince their colleagues in the face of all those other competing theories. Until the diagnosis is complete, it is not known which is the dominant cause. In addition, since many theories had been advanced, only a small minority of the theories were decisive in the solution.
With this basic understanding of the Pareto Principle, I am ready to discuss the diagnostic and remedial process at greater length in the forthcoming articles. Read next article.